Differently Sane
'Normal' is a statistical average. There may be such a thing as a normal person, but I haven't met him yet.
My comments on books, games, guns, science, politics, and whatnot.
Friday, October 9, 2026
Polymorphism is sets behind the scenes
Thursday, October 1, 2026
Everybody's good at something
Every once in a while, especially when the weather was being unspeakably foul, we'd do PT (physical training = Army speak for morning exercise) in the gym.
I have little upper body strength. I’m just not built that way. At my best, I maxed out at around 120 pounds on the bench press. The gym rats would snicker at me.
And then I’d move over to the back press. I’d take the key, normally somewhere around 100 pounds or so, and move it all the way down to the bottom - 800 pounds. Then I’d strap in and do 100 reps, nonstop. (To put that in perspective, that's 40 tons of work done in less than four minutes.)
Then I’d switch to the abdominal press and do 100 reps of 600 pounds. (It didn’t hold any more weight.)
And then I'd stretch and rest for a minute, and do it again. And again.
They stopped snickering.
Monday, September 21, 2026
"Hottest Year Ever!"
Today is 21 September, the end of summer. For the next several days, the expected high temperatures here are in the low 60s. It’s been raining for three days. Rain is expected to continue for three more.
Apologies to all those living out past the dry line. We’ve got the cold, wet weather you’ve been dreaming of. We’ve had it for most of the last 10 years. We had three consecutive years of record rainfall. Consider what that means. The farmers around here are spending the fortunes they don’t have putting in drainage under their multi-hundred acre fields so the rain water will GO AWAY and stop drowning the crops. More of this sort of tractor are showing up:
Our local community pool didn’t get a whole lot of business this year. We had a couple weeks of hot in May and June, and a week or so in July. August was notably cooler than usual, with two weeks of highs in the 60s and low 70s.
I’m old enough to remember when the grass normally died of heat and thirst in August, and the temperatures routinely got into the low 100s. Now, it’s unusual to see the temperature reach 90 degrees more than three times the whole year.
And the newsweasels keep proclaiming, “It’s the hottest year ever!”
Saturday, September 12, 2026
Quantum Madness
There is something in the teaching of quantum theory that drives people mad. It makes them unable to think coherently. A scientist can be going along, making perfect sense, then he gets to Bell’s theorem, and the train of rational thought immediately derails.
This video is the perfect example. The scientist has spent the previous 5 hours (this is the second video in the series) explaining how Einstein was correct about the explanation of quantum theory must be incomplete, because it is nonlocal. And then he explains how Bell was trying to explain Einstein’s argument about nonlocality, and used Bohm’s inherently nonlocal1 Pilot Wave theory to show how tests of quantum spin could show the “inherent” nonlocality of quantum behavior. And that’s how we get to this nonsensical chart. The chart is of tests of spin by entangled (opposite spin) particles tested by both Alice and Bob, who can each set up their detectors to align vertically, or be offset by 60 degrees.
The chart is pure gibberish. Aside from the two central lines, where coin tosses are made for “Alice 0”, and then the opposite result is shown for “Bob 0”, the data in the chart is utterly meaningless. Because the chart is conflating completely separate measurements, and jamming them all together.
You can have the central chart, where both Alice and Bob have their detectors aligned vertically. Their detections will always be opposites - down with up, and up with down. Perfect anti-correlation. This is not because of any “spooky action at a distance.” It is because, from the moment the particles were entangled, they held spin properties that were opposites - 180 degrees out of phase with each other. We don’t know what the baseline phase is, though. That’s the job of the detectors to find out. Which they do in an incredibly crude way - by making each particle go either up or down. It’s like taking a spinner from a child’s game, spinning it, and then declaring that if the pointer lands anywhere between 0 and 179 degrees, it points east, other wise it points west. Are we supposed to be surprised that the opposite end of the spinner points the other direction after each random trial?
The rest of the chart, though… is deliberately deceitful. He took coins, and flipped them, changing 25% of the answers from the “0” case for Alice and Bob. This is because, when misaligned by 60 degrees, detections will disagree from the expected (no offset) values 25% of the time. This is perfectly normal wave behavior, as defined by cos²(θ/2). So what we need is not one chart with four lines, but three separate charts, each with two lines - Alice compared to Bob at A0:B0, A+60:B0, and A0:B-60. (You can do even more charts if you want to turn the detectors the other way, but you’ll get similar results.)
And then we get to the “kill shot”. The scientist explains that at 120 degrees offset, A+60:B-60, the detections will disagree with the predicted (zero offset) values 75% of the time. And yet, his chart says they can only disagree half the time. Proof! Quantum behavior is nonlocal!
Well, no. That’s not what his chart says at all. If it did, it would disprove the very quantum theory that was used to create the chart. What he is saying is literally nonsensical - it makes no sense. Because you can’t make two separate 60 degree offset tests, and combine them to create one 120 degree offset test. That’s not how wave behavior works. A+60 and B-60 have nothing to do with each other! There is no causal correlation between them at all! Should we really be surprised that a naive comparison between them disagrees with well established theory and practice?
To make 120 degree offset tests, you have to hold one detector steady and turn the other one 120 degrees, then make your measurements. Count up the detections, and voila! You will find that 75% of the time, they disagree from perfect anti-correlation. (They’re opposites, after all.)
So, you need two new charts, each of two lines - A0:B-120, and A+120:B0. Once you do that, you’ll find a 75% disagreement. Exactly what basic wave theory predicts, whether the particles somehow “magically” influenced each other instantaneously, or whether the two particles were simply created with opposite properties, which you are now measuring for the first time.
Bell’s theory is logically incoherent. Bell’s inequality proves nothing more than that a cosine wave and a triangle wave are different. Well, duh! Nobody sane claims they are identical in the first place. But then again, those brainwashed and gaslighted by the Copenhagen interpretation can’t quite be said to be truly sane any more, as they must hold logically contradictory “facts” in their minds.
QED
Copenhagen interpretation delenda est!
Huh. I never heard about this part before. You learn something new every day.
Thursday, August 20, 2026
The geometry of energy and the conservation of rest mass
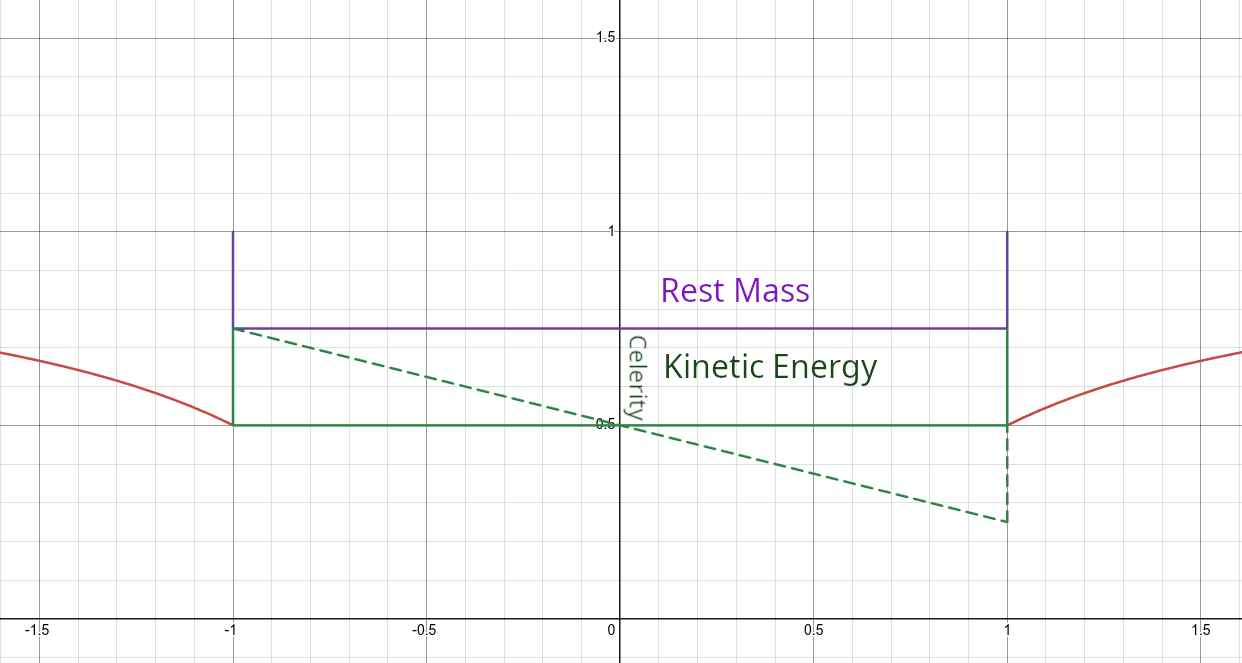
Here is the reference particle drawing for this lesson. It has a rest mass of 0.25 max, and is moving to the right with a celerity of 0.25. That makes the green triangle angle relative to the purple rest mass an angle of just over 14 degrees, which gives it a velocity (to the right) of about 0.2425 the speed of light. That gives it an alpha factor (perceived passage of time) of just over 0.97, the inverse of which is a gamma factor of just a bit over 1.03.
What is celerity? It’s what you add instead of velocities in relativity. It’s really just the tangent of the angle for which sine is the velocity and cosine is the alpha factor. It’s also velocity divided by alpha, which is equivalent to velocity times gamma.
The first thing to understand about these diagrams is that the vertical axis represents energy. So celerity is a direct measure of energy. So is mass. Unlike kinetic energy (KE = ½mv²), mass (E = mc²) is not halved.
The second thing to understand is that alpha is a horizontal scaling factor. It’s not correctly drawn here, because that’s hard, but you get the idea. As a particle speeds up, it shrinks side to side. Or at least it does from the perspective of other particles not moving along with it. It, of course, always thinks it’s stationary.
The third thing to understand is that the rest mass is conserved. What does that mean? It means the area remains constant. As celerity increases, the vertical leg of the mass rectangle increases in direct proportion to gamma. But the horizontal leg, decreases directly in proportion to alpha. The area remains constant because a scaling factor of α * 1/α = α/α = 1. Thus, even as the apparent mass energy increases by gamma, the rest mass remains constant.
The kinetic portion of the total energy ends up being the area of the dashed green triangle, shown above by the solid green rectangle. If you take half of that, you get the velocity, by no coincidence at all.
What’s the point of the green dashed lines below and above the total energy level? Those represent internal energy differentials due to the motion of the particle. This is where blue and red shift come from. Compared to the baseline of a particle sitting motionless, or directly to the side of a moving particle, a photon emitted forwards gains energy. A photon emitted rearwards loses energy.
QED
And as always, Copenhagen interpretation delenda est!

Tuesday, August 4, 2026
Relativistic Doppler Shift
The standard formula for relativistic Doppler shift is:
√((1 + v/c)/(1 - v/c)).
This multiplication factor describes the stretching out of wavelengths (reduction in energy) for light emitted from a body moving directly away from you, or the increase in the frequency (increase in energy) of light coming directly towards you. In this model, a positive velocity is moving away from you, and negative one towards you. To get the factor for frequency instead of wavelength, negate the signs for the velocity or take the inverse of the output.
For a body moving away you at 0.5c, a photon’s wavelength will increase by a factor of 1.732051. For a body moving towards you at the same speed, a photon’s frequency will increase by the same factor.
How does this work in the geometry of the particle model of gravity and motion? The factor for the wavelength of a particle moving away you (thus, decreasing in energy) is determined by taking the gamma factor (the stretching out of time, showing energy loss for a photon) and adding the inertial energy of the particle:
1/cos(asin(v)) + tan(asin(v)).
The get the factor for the wavelength of a particle moving towards you (increasing energy), subtract the energy from the gamma factor. Remember, a wavelength factor smaller than one shows an increase in energy.
To get the factor for frequency instead of wavelength, reverse the sign or take the inverse of the output. This really makes sense, because a photon’s frequency is directly related to its energy. It makes sense that a high gamma factor, showing a reduction in the perceived time of the source, would reduce the energy of any photon it emitted (regardless of direction), just as its inertial energy in your direction would add to that photon’s energy, and reduce it when traveling away from you.
QED
And as always, Copenhagen interpretation delenda est!
Friday, July 31, 2026
Relativistic energy addition
One of the “oddities” of special relativity (SR) is that velocities don’t add in the way you would expect. Given a relativistic pirate ship traveling at 0.2c from your perspective (v), firing a cannonball straight forward at 0.3c from its perspective (u’), how fast do you see the cannonball moving (u)?
The SR formula for the addition of two velocities v (your perspective) and u’ (their perspective) is: u = (v + u’)/(1 + vu’).
Plugging in the numbers, we get u = 0.471698c.
How does this work with my particle and energy model of gravity and motion? Perfectly well, once you consider the geometry (well, trigonometry) of the situation.
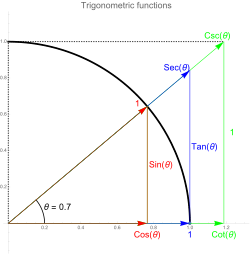
Here, as a reminder, is the handy diagram of trig identities.
In special relativity, the speed of light is always constant and defined as one. That lets us use the trig circle to define terms in a different way. Since the hypoteneuse is c (1), velocity is sine and time dilation (Lorentz alpha) is cosine. (This is the fundamental principle of SR.) Since every particle is the exact same size, energy, velocity, and acceleration are all related, with energy being equivalent to the tangent (sin/cos) of the angle. Remember, only energies are real. Everything else is derived. But we can’t see energy, so we are usually forced to do things backwards.
So, how do we add energies in a geometric way using this knowledge? Carefully, with an eye towards the definitions. We know the velocities (sines). That gives us the time dilations (alphas). That gives us the energies. But we have to remember that the cannonball’s time dilation is measured from the ship’s time dilation. Just like you cannot directly add the velocities, you cannot directly add the energies.
The velocities (sin) add. The time dilations (cos) multiply. Energy (tan) is total velocity divided by total dilation. That’s the secret to relativistic energy addition.
Given the ship’s velocity from your perspective (v) and the cannonball’s velocity from the ship’s perspective (u’), we can define angles x and y such that x = arcsin(v) and y = arcsin(u’). We want to find the velocity of the cannonball from our perspective (u).
The definition of tangent: tan(a) = sin(a) / cos(a)
The relativistic addition of energies: tan(z) = [sin(x) + sin(y)] / [cos(x) * cos(y)]
u = sin(atan(z))
u = sin(atan( [v + u’] / [ cos(asin(v)) * cos(asin(u’)) ] ))
Plugging in our numbers for v = 0.2c and u’ = 0.3c, we get x = asin(0.2) and y = asin(0.3). That gives us tan(z) = 0.534951, so u = 0.471698c.
QED
And, as always, Copenhagen interpretation delenda est!